
Serendip is an independent site partnering with faculty at multiple colleges and universities around the world. Happy exploring!
Summary of Cellular Automata as Explorers
Cellular Automata Findings
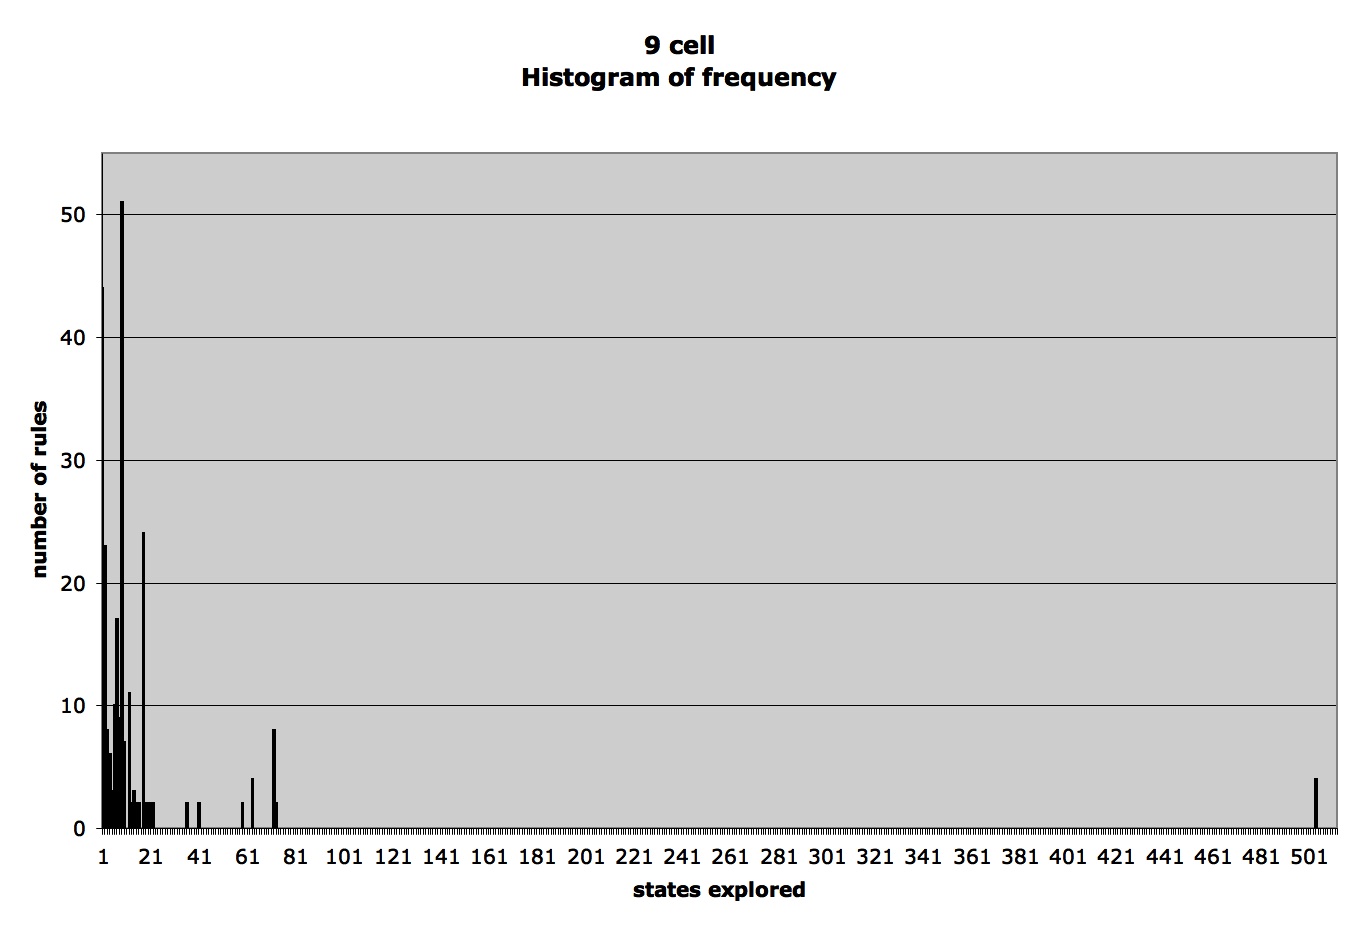
Below are measures of how many possible states (one dimensional linear arrangements) a particular rule generates. Results were taken from a 9 cell CA, 11 cell CA, and 19 cell CA. Click images to enlarge.

Percent states explored for 9 cell CA. Roughly three categories emerge: rules that are "poor explorers" (~0-3%), "moderate explorers" (~15%), and "good explorers" (~98%). Of the last category there are only four rules-- rule 45, 75, 89, and 101. Note that there are NO rules that generate all 100% of the possible linear arrangements.
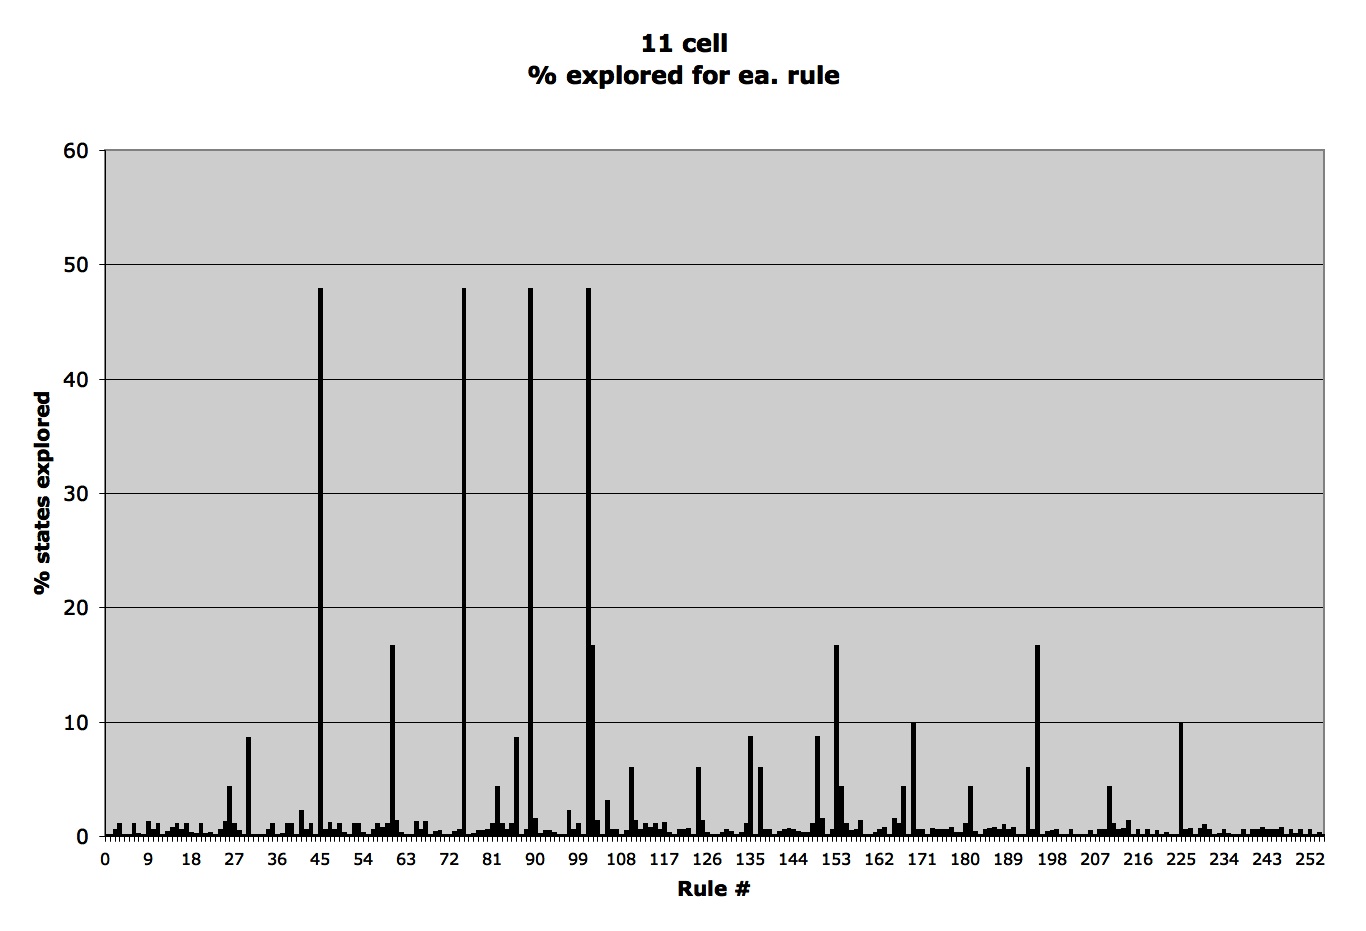
Percent states explored for 11 cell CA. Note the persistence of roughly three categories of rules based on the percent of possible states generated. As before, there are four "good explorers" (again rules 45, 75, 89, and 101), which in this case generate only ~48% possible. Also as before, there are no rules that generate every possible state.

Percent states explored for 19 cell CA. As the number of possible states increases with the width of the CA, all rules generate a smaller percentage of possible states. Rules 45, 75, 89, and 101 again exceed all other rules but still only generate ~35% of the possible states.
Remote Ready Biology Learning Activities

Remote Ready Biology Learning Activities has 50 remote-ready activities, which work for either your classroom or remote teaching.
Narrative is determined not by a desire to narrate but by a desire to exchange. (Roland Barthes, S/Z)
What's New? Subscribe to Serendip Studio
A Random Walk
New Topics
-
10 weeks 2 days ago
-
10 weeks 2 days ago
-
10 weeks 6 days ago
-
10 weeks 6 days ago
-
10 weeks 6 days ago

Comments
Post new comment